lunes, 5 de septiembre de 2016

Multitasking as Skill Acquisition

Multitasking is a critical ability that allows people to cope with and flourish in the complex world that we live in. However, as much as cognitive scientists have learned about the inner workings of human cognition, our ability to multitask remains a mystery. In this paper, we argue that we can best understand multitasking as a product of production composition (Taatgen & Lee, submitted), a computational theory of procedural skill acquisition that has been implemented within in the ACT-R framework (Anderson & Lebiere, 1998). Production composition has been used successfully to account for skill acquisition in a wide variety of domains including language learning (Taatgen & Anderson, submitted) and individual differences in complex skill acquisition (Taatgen, 2001). We believe that it can also be used to account for the acquisition of multitasking skill.
Multitasking is the ability to handle the demands of multiple tasks simultaneously. At the most basic level, this may involve executing multiple perceptual-motor actions at the same time, such as moving your attention to the next lane and turning the steering wheel. At a more complex level, this may involve interleaving the steps of many complex tasks, such as shifting down to a lower gear while navigating a curve and carrying on a conversation.
Important insights into people’s ability to multitask come from the dual-task performance literature. One such insight is that while there is some interference between the two tasks that are being performed (with a caveat regarding the modality of stimuli and responses), people can consciously trade off performing one task for the other (Wickens & Gopher, 1977). Another is that people’s performances in both tasks depend highly on their skill in the individual tasks (Allport, Antonis, & Reynolds, 1972). That is, being skilled in one task allows a person to perform it and other tasks with negligible impact on the overall performance of both tasks. For example, a skill driver might have little difficulty talking with a friend while driving, whereas a novice driver might find it difficult. 

Author: Anderson (1995)


Source:

*Agre, P. E., & Chapman, D. (1987). Pengi: An implementation of a theory of activity. In Proceedings of the Sixth National Conference on Artificial Intelligence, 268 - 272. 
Allport, D.A., Antonis, B., & Reynolds, P. (1972). On the division of attention: A disproof of the single channel hypothesis. Quarterly Journal of Experimental Psychology, 24, 255-265. 

*Anderson, J.R. (1982). Acquisition of cognitive skill. Psychological Review, 89, 369–406.

*Anderson, J.R. (1995). Cognitive Psychology and Its Implications. NY: Freeman. 

*Anderson, J.R., & Lebiere, C. (1998). The Atomic Components of Thought. Mahwah, NJ: Erlbaum. 

*Byrne, M. D., & Anderson, J. R. (1998). Perception and Action. In J. R. Anderson & C. Lebiere (Eds.), The atomic components of thought (pp. 167-200). Mahwah, NJ: Erlbaum Fitts, P.M. (1964). Perceptual-motor skill learning. In A.W. Melton (Ed.), Categories of human learning. New York, NY: Academic Press.

The Effects of Multitasking

For decades, academic research on multitasking has demonstrated that human beings work much more effectively when concentrating on a single task at any given time, and that switching between multiple tasks leads to a host of negative effects. Mobile phone usage while driving, for example, has been one of the most extensively studied instances of multitasking, and multiple studies show that drivers are seriously impaired while using cell phones. Initially, researchers thought that the physical device manipulation was responsible for the impairment, but later studies demonstrated that even hands-free devices can cause driving impairment equal to or worse than a .08 percent blood-alcohol level – the legal threshold for impairment in most states in the U.S.4 Simply trying to do two different tasks simultaneously is enough to reduce one’s effectiveness severely. Studies that look beyond the specific use case of mobile devices and driving generally show that multitasking causes serious productivity declines. Switching between tasks can cause a loss of productivity as high as 40 percent when compared to single-tasking5 and workers who multitask are much less likely to engage in creative thinking than those whose work is not fragmented6 . Long-term, habitual multitasking appears to have long-term negative effects as well. Habitual, heavy multitaskers are more susceptible to distraction by irrelevant stimuli at work than are habitual single-taskers , and multitasking makes individuals less capable of appropriately regulating their work habits8 . In sum, multitasking makes people less productive, less creative and more likely to get thrown off task by distractions.
While the negative effects of multitasking on individuals are well documented, little research has been conducted to examine the impact of multitasking on organizations as a whole. This study from Realization aims to provide original and vital research-based information and insight about the large scale impact of multitasking on organizations.


Source:
 Strayer, D. L., Drews, F. A., and Crouch, D. J. Fatal distraction? A comparison of the cell-phone driver and the drunk driver. In 
D. V. McGehee, J. D. Lee, & M. Rizzo (Eds.) Driving Assessment 2003: International Symposium on Human Factors in Driver Assessment, Training, and Vehicle Design. Published by the Public Policy 

Center, University of Iowa (pp. 25- 30). 2003. 5 Rubinstein, Joshua S., Meyer, David E., and Evans, Jeffrey E. Executive control of cognitive processes in task switching. Journal of Experimental Psychology: Human Perception and Performance, Vol. 27(4), 2001, 763-797. 6 

Amabile, Teresa M., Mueller, Jennifer S., Simpson, William B., Hadley, Constance N., Krame

Multitasking and the brain

There continues to be a significant amount of research identifying which parts of the brain are involved in specific information processing activities. It is known that the hippocampus is activated when declarative memory is used for processing context, such as information obtained from textbooks during reading or study. In contrast, a different part of the brain, the striatum, is used in the processing of procedural memory which is used for habitual tasks and activities such as bike riding or dialing a familiar number on the telephone. The types of processing that occur in these two regions are significantly different and impact storage and retrieval. The hippocampus will sort, process, and recall information involving declarative memory. Memories in the hippocampus are easier to recall in situations different from where they were learned, whereas those stored in the striatum are closely tied to the specific situation in which they were learned. It has been found that learning with the striatum while performing habitual or repetitive tasks leads to knowledge that cannot be generalized as well in new situations. (Poldrack as cited in Aratani, 2007) Having difficulty transferring knowledge from one situation to another is not consistent with the type of learning that we hope takes place in a college classroom and can be applied elsewhere and in the future. The research of Rubinstein, J., Meyer, D., and Evans, J. (2001) is consistent with earlier studies finding that multitasking takes more time and involves more errors than focus on a single task. When learning with distractions associated with multitasking, students’ brains are trying to “wing it” by using a region, the striatum, that is not best suited for long term memory and understanding. This is consistent with the findings of Delbridge (2001) who also noted that focusing on one task or a single goal results in fewer errors and less time than trying to focus on multiple tasks and goals.
Although the term multitasking is relatively new, many people might remember their first Psychology course and learning about D. E. Broadbent’s (1958) dichotic listening experiment and the theory of “selective attention”. That study involved research subjects attending to an auditory message directed to one ear while a second message was transmitted to the other ear. He found that there was little if any content from the nonattended ear that was remembered. Based on his findings, Broadbent proposed the theory of a limited processing channel (LPC) which explained that our neural circuitry has a restricted or limited capacity to deal with sensory input. This limits the amount of information that can be sent on to short term memory at any given moment in time. If information cannot be sent to short term memory, or if it is lost from short term memory, it cannot be forwarded to long term memory for storage.  


Source:

Aratani L. (February 26, 2007). Teens Can Multitask, But What are the Costs? The Washington Post. 
Ben-Shakhar, G., Sheffer, L. (2001). The relationship between the ability to divide attention and standard measures of general cognitive abilities. Intelligence 29, pp.293- 306. 

Delbridge, K. A. (2000). Individual Differences In Multi-Tasking Ability: Exploring A Nomological Network; Unpublished Doctoral Dissertation, University of Michigan, 

Hembrooke, H., Gay, G. (Fall 2003). The Laptop and the Lecture: The Effects of Multitasking in Learning Environments”, Journal of Computing in Higher Education. Vol. 15(1). 

Kieras, D.E., Meyer, D.E. (1994). The EPIC architecture for modeling human information processing and performance: A brief introduction. University of Michigan technical report-94/ONR-EPIC-1. 

Konig, C. J., Buhner, M., Murling, F. (2005). Working Memory, Fluid Intelligence, and Attention Are Predictors of Multitasking Performance, but Polychronicity and Extraversion Are Not. Human Performance 18(3), pp. 243-266. 

Multitasking

Human multitasking is an apparent human ability to perform more than one task, or activity, over a short period of time. An example of multitasking is taking phone calls while typing an email and reading a book. Multitasking can result in time wasted due to human context switching and apparently causing more errors due to insufficient attention. Studies have shown that it is impossible to multitask. However, if one is a professional at the task at hand, then it is possible to do these tasks.
Although the idea that women are better multitaskers than men has been popular in the media as well in conventional thought, there is very little data available to support claims of a real sex difference. Most studies that do show any sex differences tend to find that the differences are small and inconsistent. A study by psychologist Keith Laws was widely reported in the press to have provided the first evidence of female multitasking superiority.

Because the brain cannot fully focus when multitasking, people take longer to complete tasks and are predisposed to error. When people attempt to complete many tasks at one time, “or [alternate] rapidly between them, errors go way up and it takes far longer—often double the time or more—to get the jobs done than if they were done sequentially,” said Meyer.

Author: Rubinstein (2001)


Source:

* Rubinstein, Joshua S.; Meyer, David E.; Evans, Jeffrey E. (2001). Executive Control of Cognitive Processes in Task Switching. Human Perception and Performance. Journal of Experimental Psychology. "Sex differences in the structural connectome of the human brain". Proceedings of the National Academy of Sciences. 16 April 2014.


* Rubinstein, J. S., Meyer, D. E., Evans, J. E. (August, 2001). Executive Control of Cognitive Processes in Task Switching. Journal of Experimental Psychology: Human Perception and Performance. Vol. 27, No. 4, pp. 763-797. 

lunes, 1 de agosto de 2016

How common is divorce and what are the reasons?

In the United States, researchers estimate that 40%–50% of all first marriages, and 60% of second marriages, will end in divorce. There are some well known factors that put people at higher risk for divorce: marrying at a very early age, less education and income, living together before marriage, a premarital pregnancy, no religious affiliation, coming from a divorced family, and feelings of insecurity. The most common reasons people give for their divorce are lack of commitment, too much arguing, infidelity, marrying too young, unrealistic expectations, lack of equality in the relationship, lack of preparation for marriage, and abuse. Some of these problems can be fixed and divorce prevented. Commitment is having a long-term view of the marriage that helps us not get overwhelmed by the problems and challenges day to day. When there is high commitment in a relationship, we feel safer and are willing to give more for the relationship to succeed. Commitment is clearly a factor in why some couples stay together and others divorce. Divorce is necessary at times, and it may even help to preserve the moral boundaries of marriage. But parents have a responsibility to do all that they reasonably can to preserve and repair a marriage, especially when the reasons for divorce are not the most serious ones. Barriers to leaving a marriage, such as financial worries, can keep marriages together in the short run. However, unless there is improvement in the relationship, eventually the barriers are usually not enough to keep a marriage together in the long run.

Source:

- Suzanne M. Bianchi et al., “Housework: Who Did, Does, or Will Do It, and How Much Does It Matter?” Social Forces 91 (2012): 55–63, doi: 10.1093/sf/sos120.

- Abbie E. Goldberg. “‘Doing’ and ‘Undoing’ Gender: The Meaning and Division of Housework in SameSex Couples,” Journal of Family Theory & Review 5 (2013): 85–104, doi: 10.1111/jftr.12009.

- Human Rights Campaign, “Judge Overturns Order to Disclose Documents Detailing Publication of Regnerus’ Junk Science,” news release, April 17, 2014, http://www.hrc.org/press-releases/entry/ judge-overturns-order-to-disclose-documents-detailing-publication-of-regner. 

Marriage and Family: LGBT Individuals and Same-Sex Couples

Though estimates vary, as many as 2 million to 3.7 million U.S. children under age 18 may have a lesbian, gay, bisexual, or transgender parent, and about 200,000 are being raised by same-sex couples. Much of the past decade’s legal and political debate over allowing same-sex couples to marry has centered on these couples’ suitability as parents, and social scientists have been asked to weigh in. After carefully reviewing the evidence presented by scholars on both sides of the issue, Gary Gates concludes that same-sex couples are as good at parenting as their different-sex counterparts. Any differences in the wellbeing of children raised in same-sex and different-sex families can be explained not by their parents’ gender composition but by the fact that children being by raised by same-sex couples have, on average, experienced more family instability, because most children being raised by same-sex couples were born to different-sex parents, one of whom is now in the same-sex relationship. That pattern is changing, however. Despite growing support for same-sex parenting, proportionally fewer same-sex couples report raising children today than in 2000. Why? Reduced social stigma means that more LGBT people are coming out earlier in life. They’re less likely than their LGBT counterparts from the past to have different-sex relationships and the children such relationships produce. At the same time, more same-sex couples are adopting children or using reproductive technologies like artificial insemination and surrogacy. Compared to a decade ago, same-sex couples today may be less likely to have children, but those who do are more likely to have children who were born with same-sex parents who are in stable relationships. In the past, most same-sex couples raising children were in a cohabiting relationship. With same-sex couples’ right to marry now secured throughout the country, the situation is changing rapidly. As more and more same-sex couples marry, Gates writes, we have the opportunity to consider new research questions that can contribute to our understanding of how marriage and parental relationships affect child wellbeing.

Source:

- Justin McCarthy, “Record-High 60% of Americans Support Same-Sex Marriage,” Gallup, May 20, 2015, http://www.gallup.com/poll/183272/record-high-americans-support-sex-marriage. aspx?utm_source=Social%20Issues&utm_medium=newsfeed&utm_campaign=tiles.

- Art Swift, “Most Americans Say Same-Sex Couples Entitled to Adopt,” Gallup, accessed May 20, 2015, http://www.gallup.com/poll/170801/americans-say-sex-couples-entitled-adopt.aspx.

- Freedom to Marry, “History and Timeline of the Freedom to Marry in the United States,” accessed October 10, 2014, http://www.freedomtomarry.org/pages/history-and-timeline-of-marriage.

- Ilan H. Meyer, “Prejudice, Social Stress, and Mental Health in Lesbian, Gay, and Bisexual Populations: Conceptual Issues and Research Evidence,” Psychological Bulletin 129 (2003): 674–97, doi: 10.1037/0033-2909.129.5.674.


What is the most recent estimate of same-sex couple households?

The most recent estimate, from 2011 ACS data, shows 605,472 same-sex couple households. Of these, 168,092 reported being married couples. The figure below shows estimates of same-sex couples by relationship type (unmarried partner or spouse) and sex of the couple.

 Author: U.S. Census Bureau (2011)
Two basic kinds of change occurred between 2007 and 2008: (1) processing and editing changes and (2) formatting changes to the questionnaire. The first reflects technological improvements in data collection by interviewers and efforts to make the processing and editing more consistent between data in the ACS and the 2010 Census. The second changes the layout of the gender question to make it more difficult to accidently mark both male and female. The drop in the reported number of same-sex couples between 2007 and 2008 can be attributed to these changes, which have resulted in a more reliable estimate of same-sex couple households.
                                               
Author: U.S. Census Bureau (2011)


Source:
- Census Bureau (2013). Frequently Asked Questions About Same-Sex Couple Households. Fertility and Family Statistics Branch. https://www.census.gov/hhes/samesex/files/SScplfactsheet_final.pdf


Perfect Couple: Families

This bulletin presents annual statistics on the number of families by type, people in families by type and children in families by type. A family is a married, civil partnered or cohabiting couple with or without children, or a lone parent with at least one child who live at the same address. Children may be dependent or non-dependent. Types of family include married couple families, cohabiting couple families and lone parent families. The bulletin also presents statistics for 1996 to 2014 on the number of households by type, household size and people living alone. A household is one person living alone, or a group of people (not necessarily related) living at the same address who share cooking facilities and share a living room, sitting room or dining area. A household can consist of more than one family, or no families in the case of a group of unrelated people.
The Marriages (Same Sex Couples) Act 2013 made provision for the marriage of same sex couples in England and Wales from 29th March 2014 onwards. No married same sex couples were selected in the interview sample in the April to June 2014 quarter of the Labour Force Survey (LFS). Therefore statistics on same sex married couples, their families and their households will not be reported on within this bulletin. Early analysis of the July to September 2014 quarter shows that some married same sex couples were interviewed on the LFS.

Author:  Labour Force Survey - Office for National Statistics

Figure 1 shows that the most common family type in the UK in 2014 was a married or civil partner couple family without dependent children. There were 7.8 million such families in 2014. The next most common family type was a married or civil partner couple family with dependent children, of which there were 4.8 million in 2014. All family types have increased in number since 2004 but the fastest growing family type in the UK over the decade 2004 to 2014 was the cohabiting couple family (including both with and without dependent children). The number of cohabiting couple families grew by 29.7% between 2004 and 2014. This compares to a growth of 11.9% for lone parent families and 2.2% growth for married couple families. Despite an increase in all three types of family over the last decade, married couple families are still the most common family type in the UK, both with and without dependent children.

Source:

- National Statistics (2015). Families and Households, 2014. Statistical Bulletin. UK. http://webarchive.nationalarchives.gov.uk/20160105160709/http://www.ons.gov.uk/ons/dcp171778_393133.pdf


Valentine’s Day Fact Sheet on Sexual Health

What do you plan to give your valentine this February 14th – a bouquet of flowers, a heartshaped box of chocolates, a candlelit dinner? Have you considered the gift that keeps on giving -- a sexually transmitted infection? Sexually transmitted infections (STIs) are infections that result from the transmission of certain bacteria or viruses during physically intimate acts. An STI may or may not result in a sexually transmitted disease (STD) that has noticeable symptoms. It may seem unromantic to raise the issue of STIs on a day that celebrates love and romance. But let’s be realistic: love and romance tend to lead to sex in U.S. society today. And STIs have reached epidemic proportions in America, with 19 million new cases occurring each year. So what are the odds of becoming infected? A 2000 report estimated that a third of Americans had contracted a STI by age 24. This is why a holiday focused on love, romance, and seduction should also be a time to focus on sexual health. Researchers have discovered much useful information about STIs, but many people continue to avoid learning about these socially taboo infections.

-Virgins do not have to worry about STIs. 
- Only certain types of people get STIs. 
- People know if they are infected.
- Regular annual medical exams and HIV testing eliminates the need to worry about STIs.
- Condoms eliminate the need to worry about STIs.
- Having the ‘STI talk’ is unromantic. 

Source: 
*Bersamin, M. et al. (2007). Defining Virginity and Abstinence: Adolescents’ Interpretations of Sexual Behaviors. Journal of Adolescent Health, 41(2): 182-188.

*Nack, A (2002). Bad Girls and Fallen Women: Chronic STD Diagnoses as Gateways to Tribal Stigma. Symbolic Interaction, 25 (4): 463-485. http://www.ashastd.org/news/news_pressreleases_CDCsurveillancereport.cfm.

*St Lawrence JS et al. (2002). STD screening, testing, case reporting, and clinical and partner notification practices: a national survey of US physicians. American Journal of Public Health, 92: 1784-1788.  

Association between parasuicide and Saint Valentine's Day

Experience in a casualty department suggested to us that an unusually high number of patients who had taken an overdose of drugs presented on Saint Valentine's Day (14 February). Previous studies have shown an association between parasuicide (non-fatal deliberate self harm) and stressful events such as an unsuccessful relationship, unemployment, and physical illness.' The festival of Saint Valentine's Day may induce stress due to unrequited love, but to our knowledge the incidence of parasuicide on this day has not been determined. We therefore investigated the association between Saint Valentine's Day and parasuicide.

Author: Davenport, S. &, Birtle, J. (1990)
The 95% confidence intervals for the numbers of cases indicated an association with Saint Valentine's Day and, to a lesser extent, with Christmas Day. Significant differences in age were found among the patients according to the day of presentation: those who presented on Saint Valentine's Day and Christmas Day (median age 21 and 22 respectively) were younger than those who presented on the control days (7 February, age 28; 15 August, age 31) (p<OOl, Kruskal-Wallis non-parametric analysis of variance). The proportion of patients who were adolescent (defined as those aged 12-202) was higher on Saint Valentine's Day (45%) and Christmas Day (36%) than on the control days (7 February, 17%; 15 August, 11%). The 95% confidence intervals for the numbers of adolescent patients again indicated an association with Saint Valentine's Day and, to a lesser extent,
Christmas Day 


Source:

*Howton K ()( rridv J. shborn M, (olc 1). Adolcnccjits who takc ocrrdoscs: thcir characterixticx, problets and contact wi il hepiiig c agciices. Br 7 PIsvclatrv 1982;140 11X-23 

*BIlncrotlt J, Marsack 1'. Ihe relptitivcnes ol sclt posoninilig and scl njur Br JPschltair 1977;131:394-9.


miércoles, 29 de junio de 2016

Differences:


Author: attendancework.org

Truancy Prevention

Habitual truancy can be defined as unexcused absences from school by a minor that exceed the number of such absences allowed under state law. Each state has its own school attendance laws, which specify:

• The age at which a child must begin school
• The age at which a youth can legally drop out of school
• The number of unexcused absences that constitute truancy under the law (National Center for School Engagement N.d.)

There are variations across the states in the mandatory starting age for school and the legal dropout age and variations across jurisdictions in the legally permissible number of unexcused absences from school (Education Commission of the States 2007) While truancy is widely acknowledged to be a nationwide problem, data collection and reporting issues at the school, local, and state levels make it difficult to find data that delineates the full extent of the problem (Heilbrunn 2007).

Data is available from petitioned truancy cases, but since most truancy cases never reach a petition status this data can only suggest the breadth of the truancy problem. Between 1995 and 2005, the number of petitioned truancy cases increased from 32,800 to 52,400, an increase of 60 percent (Puzzanchera and Sickmund 2008).

The largest relative increases were seen for 16- and 17-year-olds. Chronic truancy and absence (which includes excused and unexcused absences) often start early. Nauer, White, and Yerneni (2008), for instance, reported that 20 percent of elementary school students (90,000) in New York City schools missed at least a month of school during the 2007–08 school year. There were five districts where 30 percent of more of the elementary school students were chronically absent.

Data from the Baltimore (Md.) Education Research Project showed that more than one third of the first grade cohort was chronically absent (that is, missed 1 or more months of schooling in 1 year) during at least 1 of the first 5 years in school (Balfanz et al. 2008). This early pattern lays the groundwork for the poor graduation rates from high school.

Source:

Attwood, Gaynor, and Paul Croll. 2006. “Truancy in Secondary School Pupils: Prevalence, Trajectories and Pupil Perspectives.” Research Papers in Education 21(4):467–84.

Baker, Myriam L., Jane Naby Sigmon, and M. Elaine Nugent. 2001. Truancy Reduction: Keeping Students in School. Bulletin. Washington, D.C.: U.S. Department of Justice, Office of Justice Programs, Office of Juvenile Justice and Delinquency Prevention.

Balfanz, Robert, Rachel Durham, Stephen Plank, and others. 2008. Lost Days: Patterns and Levels of Chronic Absenteeism Among Baltimore City Public School Students 1999–2000 to 2005–06. Baltimore, Md.: Baltimore Education Research Consortium

School Truancy: A Case Study of A Successful Truancy Reduction Model In the Public School

Unexcused school absenteeism, truancy, is not a new problem, but a historically present problem that has over the last decade received newfound attention as the lack of school attendance and its link with student delinquency has become more clearly identified. In 1993, “more than two-thirds of all school absences [nationwide] were non-illness-related” with absence rates reaching thirty percent each day in some communities. In 2002, more than 70,000 students every day were out of school in Colorado alone. These statistics have monumental social ramifications because truancy is often one of the first and best indicators of academic failure, suspension, expulsion, delinquency, and later adult crime. School attendance laws were first adopted by Massachusetts in 1852 as a way to curb child labor. By 1900, thirty-two states had compulsory school attendance laws, and by 1918 every state had some form of school attendance law. However, these laws were ineffective in that they were seldom enforced and relied on the “push out” method of school policy enforcement, rather than addressing the underlying issues of truancy and developing ways to keep students in school. Truant youths are often absent from school for such a period of time that it is difficult if not impossible for them to catch up. “This leads to further disengagement from school, from teachers and ultimately can lead to serious anti-social behavior like juvenile delinquency.” The traditional method for disciplining student delinquents is to exclude them. This “push out” method sends a message to struggling students that they are not wanted, ultimately forcing a student’s situation from bad to worse.

Source:
 Bell ET AL., supra note 19, at 203; E.g. Heilbrunn & Seeley, supra note 3, at 4; Gonzales ET AL., supra note 2, at 6.

Heilbrunn & Seeley, supra note 3, at 4; see also Bell ET AL., supra note 19, at 204. 34 Gonzales ET AL., supra note 2, at 6.

Heilbrunn & Seeley, supra note 3, at 4. 36 Spaethe, supra note 31, at 691; see also Bell et al., supra note 19, at 204;

Patricia Jenkins, School Delinquency and School Commitment, SOC. OF EDUC., 1995, at 221, 223. 37 Jenkins, supra note 36, at 225; see also Heilbrunn & Seeley, supra note 3, at 4.


Appendix:


Author: Gonzales ET Al (2006)

Truancy Reduction: Keeping Students in School

Truancy, or unexcused absence from school, has been linked to serious delinquent activity in youth and to significant negative behavior and characteristics in adults.1 As a risk factor for delinquent behavior in youth, truancy has been found to be related to substance abuse, gang activity, and involvement in criminal activities such as burglary, auto theft, and vandalism (Bell, Rosen, and Dynlacht, 1994; Dryfoos, 1990; Garry, 1996; Huizinga, Loeber, and Thornberry, 1995; Rohrman, 1993). Much of the work in the area of developmental pathways to delinquency shows that these behavioral problems often are followed by progressively more serious behavioral and adjustment problems in adulthood, including an increased propensity for violent behavior (Bell, Rosen, and Dynlacht, 1994; Dryfoos, 1990; Kelley et al., 1997). Further, adults who were frequently truant as teenagers are much more likely than those who were not to have poorer health and mental health, lower paying jobs, an increased chance of living in poverty, more reliance on welfare support, children who exhibit problem behaviors, and an increased likelihood of incarceration (Bell, Rosen, and Dynlacht, 1994; Dryfoos, 1990; Hawkins and Catalano, 1995; Ingersoll and LeBoeuf, 1997; Rohrman, 1993).


Source:
Baker, M.L. 2000. Evaluation of the Truancy Reduction Demonstration Program: Interim Report. Denver, CO: Colorado Foundation for Families and Children. Bell, A.J., Rosen, L.A., and Dynlacht, D. 1994. 

Truancy intervention. The Journal of Research and Development in Education 57(3):203–211. Bernat, F.P. 1996. Survey Evaluation for the Governor’s Division for Children: State Truancies and Unexcused Absences. Final Report. Phoenix, AZ: Governor’s Division for Children. 

Bureau of Labor Statistics. 2001. A Profile of the Working Poor, 1999. Report 947. Washington, DC: U.S. Department of Labor, Bureau of Labor Statistics. 

Catalano, F.R., Arthur, M.W., Hawkins, J.D., Berglund, L., and Olson, J.J. 1998. Comprehensive community- and school-based interventions to prevent antisocial behavior. In Serious and Violent Juvenile Offenders: Risk Factors and Successful Interventions, edited by R. Loeber and D. Farrington. Thousand Oaks, CA: Sage Publications, Inc. Dryfoos, J.G. 1990.

 Adolescents at Risk: Prevalence and Prevention. New York, NY: Oxford University Press.

Truant issues in our society

Should parents be held accountable for their child's attendance and behavior at school?
Should students who skip school unexcused be held accountable?
We think absolutely YES!
Is this a problem?
You bet.
Not as bad this past year as the year before...but bad.
More than 60,000 unexcused absences last year in Montgomery Public Schools.
More than 70,000 the year before.
These students weren't Ferris Buehler and directing marching bands when they skipped. 
State law says parents are responsible but right now that is not being enforced - obviously.
So next week the city council will vote on a proposed ordinance aimed at stopping this problem.
Students who are truant and wandering the streets can be picked up by law enforcement officers and taken to a designated center.
Parents of children who are truant or continue to behave badly in school could be fined or jailed if their child's actions continue.
Sounds drastic but drastic action is needed.
Creating an environment conducive to learning should be a priority and holding all accountable will help teachers, administrators and most importantly, the students themselves. (Jenner, 2013)


Source:

Jenner, R. (Octubre de 2013). Truancy troubles. Obtenido de http://www.cleveland19.com/story/8904605/editorial-truancy-troubles


jueves, 9 de junio de 2016

Ways to End Homeless and Houseless

There is a growing body of knowledge that helps us understand the nature of the problem and points the way to effective and sustainable solutions. The recommendations below highlight some of these key directions:

1. Communities should develop and implement clear plans to end homelessness, supported by all levels of government: Ending homelessness can feel like an impossible task given the overwhelming scope of the problem and its apparent complexity. But recent research and community experience with developing and implementing plans to end homelessness in Canada, the U.S., Europe and Australia, have highlighted how homelessness can be ended.

2. All levels of government must work to increase the supply of affordable housing: Ultimately, reducing homelessness is going to rely on adequate market rental, affordable rental and deep subsidy rental housing including Permanent Supportive Housing. Canada will not see a sustained reduction in homelessness without a significant increase in the affordable housing supply. The Federal government plays an important, but not exclusive, role in that housing infrastructure.


3. Communities – and all levels of government – should embrace Housing First: Housing First need not only be considered a program response. It is best applied as a philosophy that underpins plans to end homelessness, as part of a broader and more strategic response that ensures that all parts of the system support the Housing First agenda and that dedicated programs deliver the service. The success of the At Home/Chez Soi project demonstrates that Housing First Works. The successful application of the model in communities across the country demonstrates how it can be done and adapted to different contexts. 

No housing readiness requirements 

Choice and self determination 

Individualized support services Harm reduction 

Social and community integration 

4. Eliminating chronic and episodic homelessness should be prioritized: The chronically homeless often face higher levels of victimization, poorer health, high instances of substance abuse and mental health concerns. The longer an individual remains homeless, the more entrenched these issues become and the likelihood of effective intervention decreases. Though small in numbers, these individuals utilize a large portion of emergency services across the homeless sector but also in health, criminal justice and social services. Effective intervention for the chronically homeless requires an intensive, client-centered approach built on trust and long-term support. 

5. Ending Aboriginal Homelessness should be prioritized as both a distinct category of action and part of the overall strategy to end homelessness: Homelessness in Aboriginal communities is disproportionately high, especially in urban areas. As such, it should be prioritized in order to reduce discrimination and the legacy of cultural disruption. At the same time, strategies to end homelessness must include components that address issues of Aboriginal Homelessness (along with other distinct and marginalized groups such as racialized communities, or LGBTQ youth).


Source:

-Crewson, B., Moreno, A., Thompson, D., Kerr-Southin, M. (2011). Streets to Homes Pilot Program Evaluation. Victoria: Greater Victoria Coalition to End Homelessness. 

-Dachner, N., and Tarasuk, V. (2013). Homeless Youth, Nutritional Vulnerability, and Community Food Assistance Programs. In S. Gaetz, B. O’Grady, K. Buccieri, J. Karabanow, & A. Marsolais (Eds.) Youth homelessness in Canada: Implications for policy and practice. Toronto: Canadian Homelessness Research Network Press. 

-Dunlop, J. (2006). Privatization: how government promotes market based solutions to social problems. Crit Soc Work; 7. 

-Eberle, M., Kraus, D., Pomeroy, S., & Hulchanski, D. (2001). Homelessness - Causes & Effects: The Costs of Homelessness in British Columbia. Victoria, BC: Ministry of Social Development and Economic Security.

-Eberle, M., Krauss, D., Serge, L. (2009). Results of the pilot study to estimate the size of the hidden homeless population in Metro Vancouver.

Causes of Homelessness and Houselessness

People who are homeless are not a distinct and separate population. In fact the line between being homeless and not being homeless is quite fluid. In general, the pathways into and out of homelessness are neither linear nor uniform. Individuals and families who wind up homeless may not share much in common with each other, aside from the fact that they are extremely vulnerable, and lack adequate housing and income and the necessary supports to ensure they stay housed. The causes of homelessness reflect an intricate interplay between structural factors, systems failures and individual circumstances. Homelessness is usually the result of the cumulative impact of a number of factors, rather than a single cause.


Structural factors: are economic and societal issues that affect opportunities and social environments for individuals. Key factors can include the lack of adequate income, access to affordable housing and health supports and/or the experience of discrimination.

Systems failures: occur when other systems of care and support fail, requiring vulnerable people to turn to the homelessness sector, when other mainstream services could have prevented this need.

Individual and relational factors: apply to the personal circumstances of a homeless person, and may include: traumatic events (e.g. house fire or job loss), personal crisis (e.g. family break-up or domestic violence), mental health and addictions challenges (including brain injury and fetal alcohol syndrome), which can be both a cause and consequence of homelessness and physical health problems or disabilities.

Source:
-Alberta Human Services (2011). Income Support - Alberta Human Services - Government of Alberta. Retrieved from: http://humanservices. alberta.ca/financial-support/689.html. Alliance to End Homelessness in Ottawa. (2012). Report Card on Ending Homelessness in Ottawa January-December 2012. Retrieved From: http://www.endhomelessnessottawa.ca/homelessness/documents/ReportCardonEndingHomelessnessinOttawaJanDec2012.pdf 

-Aubry, T., Farrell, S., Hwang, S. & Calhoun, M. (2013). Identifying the Patterns of Emergency Shelter Stays of Single Individuals in Canadian Cities of Different Sizes. Housing Studies, 2013:3-12. 

-Belanger, Y., Weasel Head, G., & Awosoga, O. (2012). Assessing Urban Aboriginal Housing and Homelessness in Canada. Ottawa: National Association of Friendship Centres (NAFC) and the Office of the Federal Interlocutor for Métis and Non-Status Indians (OFI), Ottawa, 

-Ontario Burczycka, M. & Cotter, A. (2011). Shelters for Abused Women in Canada, 2010. Jurisdat, Component of Statistics Canada catalogue no. 85-002-X. Calgary Homeless Foundation (2011). Calgary’s 10 Year Plan to End Homelessness 2008-2011. Retrieved from: http://calgaryhomeless. com/assets/10-Year-Plan/10-year-plan-FINALweb.pdf

Appendix:

Author: Gulliver, T. (2014)

 Table #1: Affordable Housinng in Canada
Author: Gulliver, T. (2014)

Who are Homeless and Houseless?

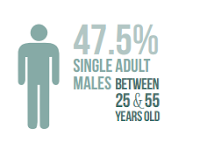
While homelessness can affect any number of people, we do know that some groups of people are more likely to be homeless than others. Single adult males, between the ages of 25 and 55, account for almost half of the homeless population in Canada (47.5%), according to a Government of Canada study.

-YOUTH: Youth make up about 20% of the homelessness population, though the prevalence rate is the same for adult men. 

-ABORIGINAL PEOPLE: First Nations, Métis, and Inuit peoples are overrepresented amongst homeless populations in most communities in Canada. This necessitates the inclusion of their historical, experiential and cultural differences, as well as experiences with colonization and racism, in consideration of Aboriginal homelessness. 

-WOMEN AND FAMILIES: Violence and poverty are the main causes of homelessness for women and families. There is some evidence that family homelessness is a growing problem in Canada.

In 2013, According to CAEH (Canadian Alliance to End Homelessness) says:
Based on our estimate of the total number of homeless people who use shelters on an annual basis (200,000), we can project the following numbers of chronic, episodic and transitionally homeless persons in Canada: 
CHRONIC HOMELESS: 4,000 to 8,000 

EPISODIC HOMELESS: 6,000 to 22,000 

TRANSITIONALLY HOMELESS: 176,000 to 188,000


Source:
-Statistics Canada (2013). Table 282-0116 - Labour force survey estimates (LFS), by census metropolitan area based on 2006 census boundaries, 3-month moving average, seasonally adjusted and unadjusted, monthly (persons unless otherwise noted), CANSIM (database). Retrieved from: http://www5.statcan.gc.ca/cansim/a26?lang=eng&retrLang= eng&id=2820116&paSer=&pattern=&stByVal=1&p1=1&p2=37&tabMode=dataTable&csid=

- Murphy, B., Zhang, X. and Dionne, C. (2012). Low Income in Canada: a Multi-line and Multi-index Perspective. Income Research Paper Series. Ottawa: Statistics Canada, pp.59-61.

- The Province of British Columbia (2007). Rate Tables Income Assistance - Ministry of Social Development and Social Innovation, Province of British Columbia. Retrieved from: http://www.hsd.gov.bc.ca/mhr/ia.htm.

-Canada Mortgage and Housing Corporation (2008). Canadian Housing Observer: “Ownership Rates, Canada, Provinces, Territories and Metropolitan Areas, 1971–2006. Retrieved from: http://www.cmhc-schl.gc.ca/en/corp/ about/cahoob/data/upload/Table8_EN_w.xls


Appendix:
Author: Flores, R. (2005)


Author: Flores, R. (2005)

What is Homeless and Houseless?

A homeless individual is defined in section 330(h)(5)(A) as “an individual who lacks housing (without regard to whether the individual is a member of a family), including an individual whose primary residence during the night is a supervised public or private facility (e.g., shelters) that provides temporary living accommodations, and an individual who is a resident in transitional housing.” A homeless person is an individual without permanent housing who may live on the streets; stay in a shelter, mission, single room occupancy facilities, abandoned building or vehicle; or in any other unstable or non-permanent situation.
While Houseless person is defined like "someone who lives on the streets, they don't need a home to live in. They don't need a roof over their head. Their home is the streets."

Differences Between Homeless and Houseless:

Many think so, but they are different and overlap. Many think that if you have a roof over your head – housed that is (shelter, rooming house, somebody’s couch) then you are not homeless. They think you are homeless only if you live outside, on the streets. They are wrong. If you don’t get the difference, think about it until you do. Read the words of the homeless veteran below and see if anything clicks. The old saying, “home is where the heart is” is quite valid and true. Just because a homeless person is in shelter or sleeping on a friend’s couch, or living in a cheap motel, doesn’t mean he or she is not still homeless. 
They may be housed and homeless at the same time. This is a big issue and a terribly sore spot with the homeless. To them there is a world of difference; almost fighting words! There are homeless veterans and houseless veterans, two different levels of homeless, but don’t say that someone housed cannot be homeless. The houseless veteran is one that sleeps in a doorway or back alley or along some creek bank somewhere. The homeless veteran covers that and also the housed that cannot make a home out of their accomidations.


Homeless:                                                                                                   Houseless:


Author: Schrdinger, I. (2005)   


Source:
https://www.nhchc.org/faq/official-definition-homelessness/
http://www.urbandictionary.com/define.php?term=Houseless

lunes, 16 de mayo de 2016

Ending Youth Homelessness Before It Begins

According to National Alliance To End Homelessness (2009), Family conflict and abuse are consistently identified by unaccompanied homeless youth as the primary reasons for their homelessness. A system aimed at ending youth homelessness must include prevention and early intervention services that address underlying abuse and family dysfunction and achieve family reunification. Within this framework, prevention services are those that improve family functioning and prevent the abuse and conflict that lead to runaway and throwaway scenarios. Early intervention services are programs designed to respond to the early stages of a youth’s homelessness with re-housing through family reunification, guardianship, or placement in youth housing programs.

Recognizing the need for crisis intervention and prevention activities, the National Alliance to End Homelessness encourages community planners and youth services agencies to develop and implement a service spectrum with the following components:
*Street and community-based outreach to link youth with appropriate services;
*Prevention and early intervention services geared toward family preservation;
*Crisis emergency shelters with case managers seeking family reunification, and;
*Youth housing with positive youth development services.

All of this, are represented in the next diagram:

Author: National Alliance To End Homelessness (2009)

Appendix:

Author: Gulliver, T. (2014) 


Source:

Ways To End Youth Homeless

National Alliance to End Homelessness conference in Seattle featured dozens of successful programs across the U.S. The best give homeless youth a meaningful role in program planning. They build on the innate tendency of adolescents to bond with small groups that feel like surrogate families, and teach group members to encourage each other in behaviors that will lead to a better life. Successful programs also ensure that LGBT kids — who represent 20 to 40 percent of homeless youngsters, but just 4 to 10 percent of youth in general — feel welcome.Understandably, building effective programs for these youth is very different from working with homeless adults and families.
There 5 ways to end youth homelessness according to Lighfoot, J. (2013)


1. Preventing youth homelessness and reuniting families:
Kids are less likely to leave home in the first place if they get along with their parents. Cocoon House teaches parenting skills to adults wanting better relationships with their children ages 13 to 17. Coaching is done through confidential phone consultations, support groups and in-home family counseling. Prevention and reconnection have the added benefit of reducing demands on more costly services.


2. Ensuring education and employment opportunities:
Many youngsters in the program secure internships in real-world fields such as construction, food service and computer technology. All participating youth are paid for their time. Program costs are kept low through volunteer support and partnerships with businesses, private foundations, other nonprofits and faith communities.


3. Mobilizing philanthropists:
Funders Together is a national network of philanthropies committed to ending homelessness through strategic collaboration and grant-making.


4. Turning social-service “silos” into systems:
Funders, agencies, and elected officials in King County have formed a Youth and Young Adulta Homelessness task Forceto develop a systems model that will coordinate separate sectors and programs in order to end homelessness among the county's young people.


5. Sending strong messages:
The general public and elected officials must see the value of taking smart steps, now, to end youth homelessness. Conference participants learned from Fostering Media Connections and others how agencies can frame compelling messages aimed at different audiences.


Source:

Runaways/Thrownaways around the world

According to Flores, J (2005). says trying to find an accurate “count” of the number of homeless youth is problematic and confusing, with estimates showing wide differences. An older 2002 federal Office of Juvenile Justice and Delinquency Prevention study estimated 1.65 million youth lived outside of their homes,7 while a decade earlier 2.8 million youth per year were identified as runaways.
The number of U.S. youth estimated to have had a runaway/thrownaway episode in 1999 is 1,682,900 (see table 1). Of these, an estimated 628,900, or 37 percent, were “caretaker missing” youth. Only an estimated 357,600 youth, or 21 percent of all runaways/thrownaways, were reported missing to police or to a missing children’s agency for purposes of locating them.  Based on 17 indicators of harm or potential risk, 1,190,900 of the runaway/thrownaway youth (71 percent) were estimated to be endangered.
And according to Colby, I (2011). In 2007, the number of homeless youth fluctuates between 1 million and 1.7 million. The number of homeless youth in any given year between 1.3 and 2.8 million. In an undated factsheet published by The National Coalition for the Homeless the number of homeless youth is reported to be approximately 1.7 million, a number similar to that reported in a 2009 New York Times article that estimated upwards of 1.6 million youth living on the streets between 2008 and 2010.

Author: Flores, R. (2005)
Source:
-Colby, Ira (2011) "Runaway and Throwaway Youth: Time for Policy Changes and Public Responsibility," Journal of Applied Research on Children: Informing Policy for Children at Risk: Vol. 2: Iss. 1, Article 4. Available at: http://digitalcommons.library.tmc.edu/childrenatrisk/vol2/iss1/4

-U.S. Census Bureau. 2000. Monthly Postcensal Resident Population, by Single Year of Age, Sex, Race, and Hispanic Origin (e9899rmp.txt, e9999rmp.txt, and e9900rmp.txt). Web site: eire.census.gov/popest/ archives/national/nat_90s_detail/nat_90s_1.php.

-Finkelhor, D., Hotaling, G., and Sedlak, A. 1990. Missing, Abducted, Runaway, and Thrownaway Children in America. First Report: Numbers and Characteristics National Incidence Studies. Washington, DC: U.S. Department of Justice, Office of Justice Programs, Office of Juvenile Justice and Delinquency Prevention.


Appendix:


Author: Flores, R. (2005)


sábado, 14 de mayo de 2016

What is Throwaways and Runaway?

According to Colbi (2011) The traditional American dream of owning a home, obtaining a college education, and working at a good, paying job is only that, a dream, for scores of homeless youth in America today. There is a growing street population of young people who have been thrown out of their homes by their caretakers or their families, and who face life-threatening situations each day. For these youth, the furthest thing in their lives is reaching the so-called “American Dream;” and their most immediate need is survival, simply living out the day in front of them. 
Currently, on anglophone countries Runaways and Throwaways is a growing trouble. In America and Europe there some help's programs to try to avoid those cases. An example of this, is Homeless Youth. They're have branches in many parts of the world, one of them is Latin America (see the video)
Sometimes those programs help people and then, they record them to look at the change of their friends. An example is Perry's Story (see the video)
Runaways and throwaways are most vulnerable to falling prey to the sex trade, selling drugs, or being lured into human trafficking, and some steal or panhandle.

https://www.youtube.com/watch?v=cdAwMCSEu1M  -  Perry's story
https://www.youtube.com/watch?v=MvjqBW_422w   -  Homeless youth in Latin America


Source:
-Fernandes A. Runaway and Homeless Youth: Demographics, Programs, and Emerging Issues. Washington, DC: Congressional Research Service; 2007.

-U.S. Department of Education. Education for homeless children and youth program: title VII-B of the McKinney-Vento Homeless Assistance Act, as amended by the No Child Left Behind Act of 2001, non-regulatory guidance. Washington, D.C.: U.S. Department of Education; 2004.

Translate